C# Debugging for Beginners (h4-04)
Great, you’ve managed to write your first C# program. Unfortunately, the program doesn’t do what it’s supposed to. The best thing you can do then: Learn how the C# debugger works and use it as often as you can. I’ll show you the most important things a beginner needs to know about the Visual Studio Debugger.
Watch the program at work
There are many good tutorials about the Visual Studio debugger. However, most of the time it is assumed that you have already written some more C# code. But I find that the debugger is super helpful right from the start. For this I start with a very simple program:
using Woopec.Core;

internal class Program
{
    public static void TurtleMain()
    {
        var seymour = Turtle.Seymour();

        seymour.Left(60);
        seymour.Forward(100);
        seymour.Left(60);
        seymour.Forward(100);
        seymour.Left(60);
        seymour.Forward(100);
        seymour.Left(60);
        seymour.Forward(100);
        seymour.Left(60);
        seymour.Forward(100);
        seymour.Left(60);
        seymour.Forward(100);
    }
}
This is a program that works with Woopec Turtle Graphics (see this post). But you can also use any other simple C# program as an example.
All necessary commands can be found in the Debug menu of Visual Studio:
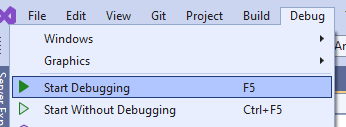
With the debugger you can run the program step by step and check what it does. Each command can also be executed via a function key on your keyboard. For example, you can start the debugger with the F5 key. If possible, you should set up your computer so that you can work with the function keys. If this is not possible, you can use the menu items or click on the appropriate icons that Visual Studio displays below the menu.
Start debugging
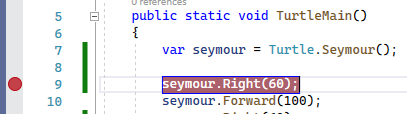
Before you start the program (and also while the program is running), you can place the cursor on a line in the program and select the F9 key (or the “Toggle Breakpoint” entry in the debug menu). The statement will then be highlighted in red and the line marked with a dot:
This means that a breakpoint is now set there.
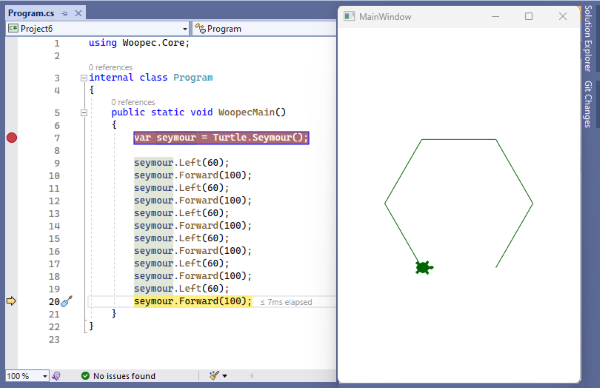
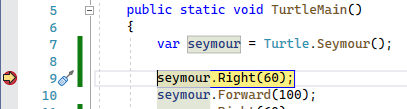
Then you start debugging (F5 key). The program is started and the debugger stops at the first breakpoint and indicates this by marking the position in yellow:
Organize the windows
Before you continue, you should place the Visual Studio window and the program window side by side. In Windows 11, this is easily done by moving the mouse to the Resize icon and then selecting the option to display Visual Studio on the left side of the screen:
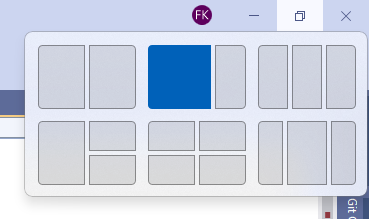
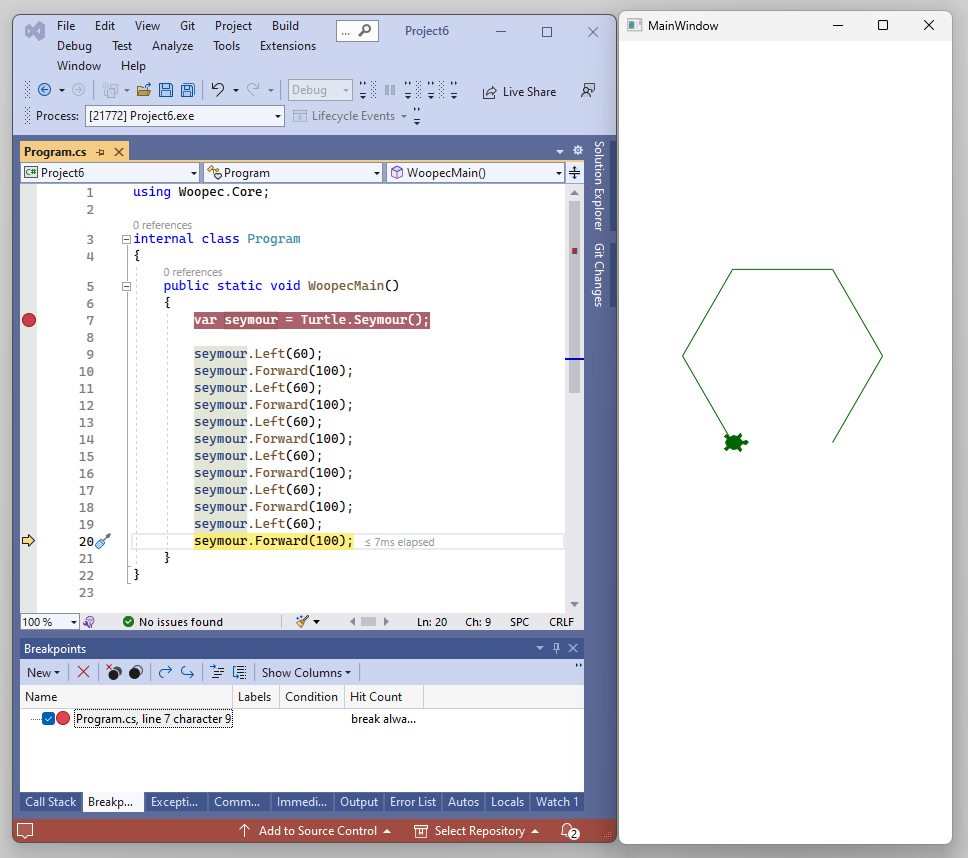
After you click on the blue rectangle, Visual Studio shrinks to the left half of the screen and a list of windows is displayed to the right of it, from which you can select the window for the right half. Here you choose the program window. The arrangement of the windows should then look something like this:
Perhaps the editor window of your Visual Studio is relatively small. You can improve this by changing the window layout of Visual Studio. How this works is described in Microsoft Learn. The best way is to save the current layout via “Save Window Layout” under a meaningful name (for example “DebuggingDefault”). After that we clean up the windows a bit: First, we close the “Diagnostic Tools” window. This allows the editor window to use the whole width. We can also move all windows from the bottom right to the bottom left window, so that there are only two windows left. Then we can save this Window layout under a different name, for example “DebuggingSmall”. Now Visual Studio looks like this:
Execute the program step by step
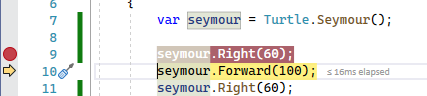
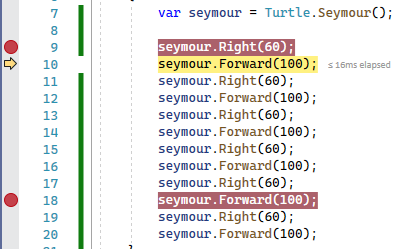
Now you click once in the code editor of Visual Studio, so that the focus is in Visual Studio. Then you can execute the program step by step: By pressing key F10 (function “Step Over” in the Debug Menu) the next statement of the program will be executed. So in the example above, the Turtle rotates 60 degrees to the right. In the Visual Studio window the yellow marker moves to the next statement:
The next click of F10 will execute the next statement. You can also set another breakpoint, for example in the line further down:
If you then select the F5 key (or “Continue” in Debug menu), the program continues to run normally and only stops again when it has reached this breakpoint.
With the Shift-F5 key (or “Stop Debugging” in Debug menu) you can stop debugging at any point.
Debugging is extremely helpful because this way you can watch your code at work. If something doesn’t work as desired, you can quickly find the error. When I changed something in my program, I always do it like this: I set a breakpoint on the first statement I changed, then start the debugger and check step by step if the program does exactly what I thought it would.
An important point: If you want to change the code of your program, you should stop debugging before.
If you are at the very beginning of learning programming, you may know enough about debugging for now (and you may want to continue learning with this post). If you have already programmed a bit more, you might be interested in how to debug variables and methods. I will describe this next.
A slightly larger example
For the description of the next debugger features I use this example::
public static void WoopecMain()
{
    var edgeLength = 100.0;
    var seymour = Turtle.Seymour();
    DrawHexagon(seymour, edgeLength);
    seymour.Right(120);
    DrawHexagon(seymour, edgeLength);
}

public static void DrawHexagon(Turtle turtle, double length)
{
    for (int edge = 0; edge < 6; edge++)
    {
        turtle.Left(60);
        turtle.Forward(length);
    }
}
Debugging of variables
When using variables, errors can happen. But also here the debugger helps. If you put the cursor on the check edge < 6, you can create a breakpoint there with F9 (see above). When you then start the program in the debugger (with F5), it stops at this breakpoint. You can then see in the debugger what values the variables have:
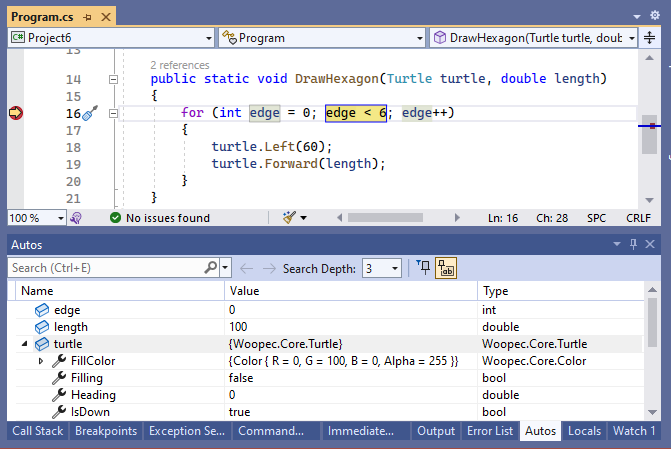
Below the code window, Visual Studio displays an Autos window. This window displays the values of the variables that are currently playing a role. You can see in this example that edge has the value 0 and length has the value 6. You can then run the code step by step (with F10) or until the next breakpoint (with F5) and always see the current value of the variable.
The debugger has many more features for variables. For example, you can also display the content of a class, as I did with the turtle parameter in the image above. Or also: moving the mouse cursor over a variable in the code will automatically display its value. You can find more information about debugging variables in the Microsoft documentation.
Debugging of methods
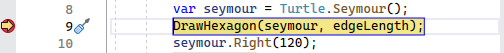
Now we set a breakpoint in the first line that calls this method:
We have two options:
- Debug/Step over (F10): With this we execute the method DrawHexagon and go to the next line in the method WoopecMain.
- Debug/Step into (F11): With this we go into the method DrawHexagon and can debug what this method does.
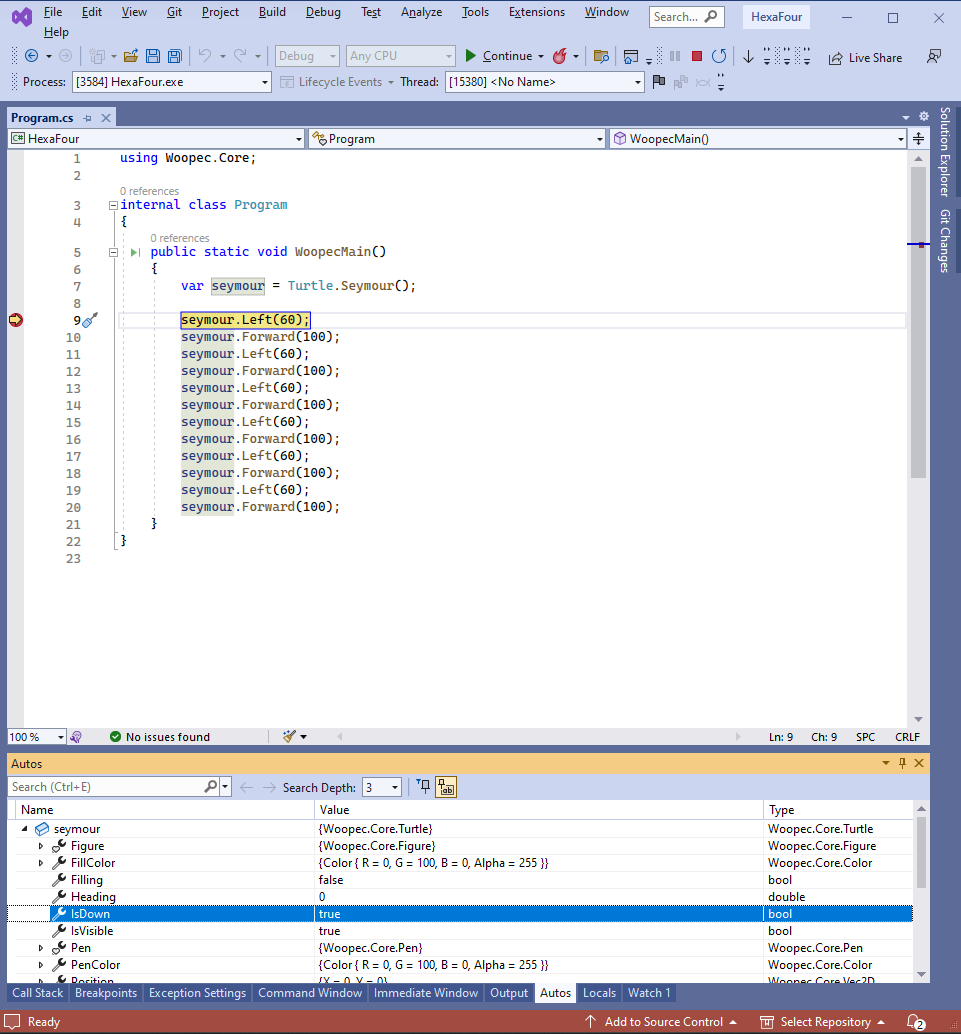
After we have called “Step into”, we see this:
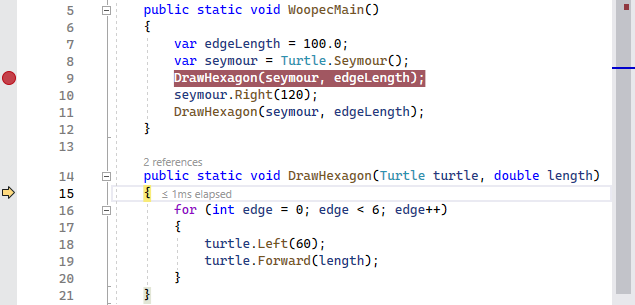
The debugger is now at the beginning of the method DrawHexagon. This is indicated by the yellow arrow. Using the debugger’s watch functions, we can now see, for example, that the parameter length has the value 100.0.
We can now step normally (with F10) through the individual lines of the method until we have reached the end of the method. If we then press F10 again, the program “jumps” out of the method again and we are back at the calling point at line 9 in WoopecMain.
Another tip: If, for example, you have reached line 17 when debugging the method DrawHexagon and you are no longer interested in the execution of the rest of the method, you can select “Debug/Step out” (Shift+F11). The program then executes the rest of the method immediately without debugging, jumps back to the calling point and then stops again in the debugger.
Call stack and variables
Now start the program again in the debugger and stop in line 18. If you move the mouse pointer over the parameters or variables of the method, you can see their values. For example, the value of length is 100. If you move the mouse pointer over a WoopecMain variable, for example edgeLength, you will not see anything. This is because the program only “sees” these variables again when the DrawMethod method has ended and the program flow continues in line 10.
Nevertheless, these variables are always there, they are just a little further down in the so-called call stack. We can see this when using the Call Stack window of the debugger (if it is not there yet, you can find it in the list of windows in the debug menu):
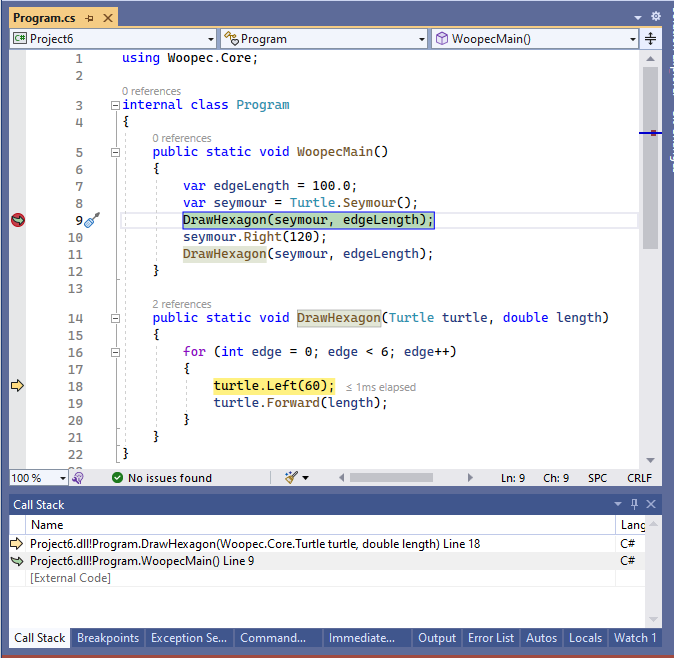
In the Call Stack window, you can see all the methods in the order in which they were called. The current method is at the top, so here DrawHexagon. Below it is the method that called DrawHexagon, that’s here WoopecMain. Double-click on a line in the Call Stack window to switch the display to this method. In the image above, I clicked on the line in the Call Stack window that contains WoopecMain. That’s why line 9 is now highlighted in green. As a result, I can now display the values of the WoopecMain variables in the debugger. If I click on the DrawHexagon line in the Call Stack window, I can switch back to the variables of DrawHexagon.
In this way, you can analyze the entire state of the program. Not only the state of the method in which the program is currently located, but of all methods that have just called this method.
Reference types as parameters of methods
In the debugger, we can also observe very well what methods do with their parameters. In the example above, the DrawHexagon method has the parameter turtle. The type of this parameter is Turtle, this is a C# class from the Woopec library. If you execute the code in line 18 in the example above, the value of Heading changes from 0 to 60. Now switch to the WoopecMain variables using the Call Stack window and look at the Heading property of the variable seymour. The value of Heading has also changed to 60!
This is because every C# class is a so-called reference type. If you pass such a variable (in this case seymour) as a parameter to a method, and this parameter is changed within the method, then this has a direct effect on the variable and it is changed.
The length parameter is different. This is of type double, and this is a so-called value type. If you pass such a variable (in this case edgeLength) as a parameter to a method, and this parameter is changed within the method, then this has a no effect on the variable and it is not changed. You can try this out directly by changing the value of length and checking whether this has an effect on the value of edgeLength. You can rewrite the program a little, but it is even quicker to do this directly in the debugger:
Change values of variables via the debugger.
You can also change variables using the debugger. This can be done via the debugger’s Autos window or directly by moving the mouse over the variable:
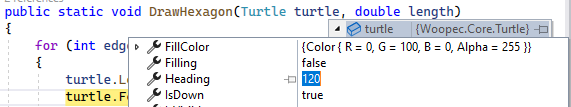
In this example, I moved the mouse over the turtle parameter, then opened the properties of the class and double-clicked on the value of the Heading property. I can change this value, for example to 180, and then confirm with Return. The value in the program is then changed accordingly.
In the same way, you can change the value of the length parameter and check whether it affects the value of the edgeLength variable. Because double is a value type, edgeLength does not change.
The bottom line
That was a lot of technology. But the debugger is very useful if you are looking for errors and want to understand how the program works.
In the next post, we’ll continue with our HexaFour game. Until then you can play around with the Turtle commands, write your own programs and debug them. For example, you could try to draw a hexagonal star.
TL;DR
This post is part of a series. You can find the previous post here and an overview here.
Debugging:
- Start debugging with F5, set breakpoint with F9, step over with F10, to next breakpoint with F5, end debugging with Shift F5.
- Step into a method with F11, step out of a method with Shift F11.
- The Autos window shows the values of variables.
- The Call Stack window shows the currently called methods and can switch between the methods.
- For more information on debugging, see for example the videos C# 101 Debugging and .NET Core 101 Basic Debugging or the article First look at the debugger on Microsoft Learn.
If you want to change the code of your program, you should stop debugging before.
Comment on this post ❤️
I am very interested in what readers think of this post and what ideas or questions they have. The easiest way to do this is to respond to my anonymous survey.