Why is this simple C# Program not working? Fixing Compiler Errors and using the Visual Studio Debugger (h4-04)
You have written your first C# program and it compiles with errors? This is quite normal in the beginning. Don’t let that stop you from learning C#. Here I explain some of the most common errors and how to fix them. Your program runs, but doesn’t do what it’s supposed to do? This is also quite normal. With the Visual Studio Debugger, you can see step-by-step what your program is doing and quickly find out what is wrong.
CS1002 ; expected
Let’s start with an example:
internal class Program{static void Main(string[] args){Console.WriteLine("Hello World")}}
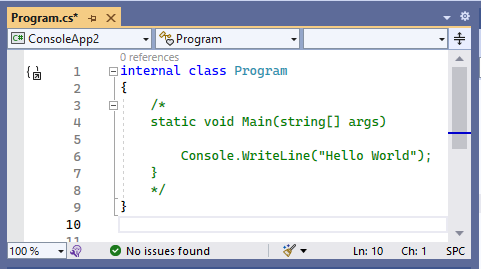
The C# compiler has a problem with this program, it expects a semicolon somewhere. That is why it issues the error message “CS1002 ; expected”. In the code example above, I intentionally wrote everything on one line, because that is more like how the compiler sees your program code. You would write the above program more like this:
internal class Program
{
    static void Main(string[] args)
    {
        Console.WriteLine("Hello World")
    }
}
From the compiler’s perspective, this version of the program is just like the first one. The C# compiler does not care about spaces, indentations or line breaks in your program. That is why it needs a sign by which it can determine that a statement has come to an end. And this sign is the semicolon. Each statement must be terminated with it, otherwise the compiler will not recognize it. So you have to add a semicolon after the statement that prints “Hello World”.
Visual Studio does a lot to help you fix such errors:
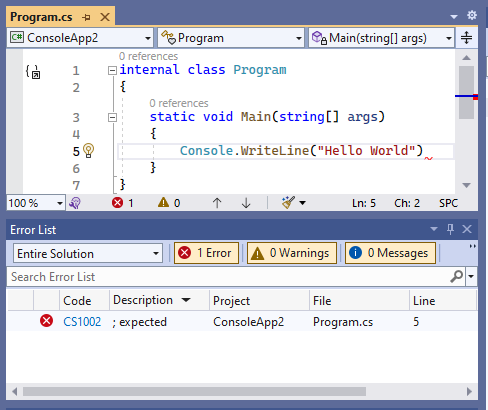
(1) The error is displayed in the Error List. (2) If you click on the link CS1002, you will see a description of the error. (3) In the editor, at the end of line 5, the error location is marked with a red squiggle. And (4) the light bulb at the beginning of line 5 offers you Quick Actions to fix the error. These Quick Actions don’t help with this particular error, but the other offerings should help with this type of error.
Brackets that do not match
C# uses different types of parentheses to indicate the beginning and end of something:
- Curly braces
{and}mark the beginning and end of a code block. - Square brackets
[and]mark the beginning and end of list-like things. - Round brackets
(and)enclose the parameters of methods.
If there is a bracket in a file without a matching partner, then the C# compiler also has a problem. If a closing bracket is missing, we usually get appropriate error messages:
- CS1513 } expected
- CS2026 ) expected
- CS1003 ] expected
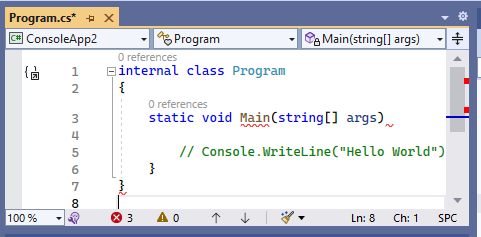
The cause of such errors is relatively easy to find if your program is small. But it becomes more difficult if the program has many lines. The compiler only knows that a bracket is missing, but not where it is missing. That is why it displays the error in this example like this:
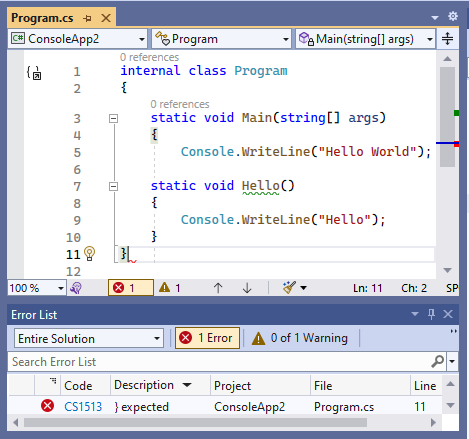
The error is displayed at the very end of the file. But how do you find the place where the bracket is really missing? There are options here as well: For one thing, you can put the cursor behind the last bracket. Then Visual Studio displays this bracket with a gray background, and it displays the corresponding opening bracket also with a gray background. In the example above, this is the bracket in line 4. This doesn’t fit properly, and you can see that line 6 is missing a closing parenthesis. On the other hand, you can also make the cursor jump to the corresponding opening parenthesis. For this you use the keyboard shortcut Ctrl+].
If the faulty spot is difficult to find
If your program is missing an opening parenthesis, the C# compiler has more trouble giving you a good error message. Because the opening bracket is missing, the compiler does not understand the code behind it correctly and displays many error messages:
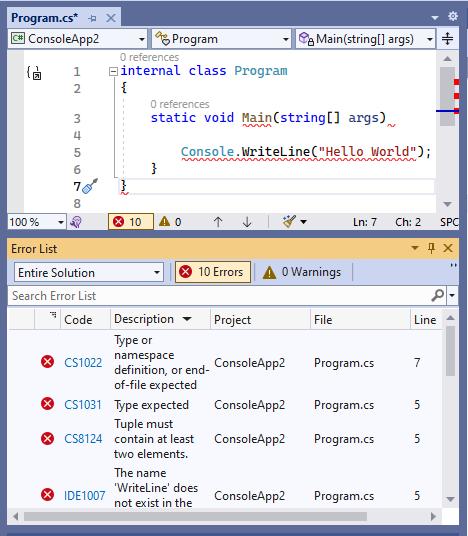
Fortunately, it is not so common that an opening bracket is missing. But in such cases it is more difficult to find the error. In this example an opening parenthesis is missing in line 4. This has generated 10 compiler errors! And the first error is printed one line in front of the real error! The only thing that helps here is to stay calm and try to narrow down the location where the error is likely to be. If you can’t find the error at all, you can try to make your program smaller. You don’t have to delete any lines of the program for that, you can comment them out. A comment is a part of your code that the compiler does not even consider. Normally you use this to comment for others how the code is intended. You can find a description of comments in Microsoft Learn. Here I put a part of the program in a comment, and after that there are no more errors. That’s why the cause of the error must be in the commented out part of the program:
Next, I commented out a smaller part. Now there are errors again. So the error must be somewhere in line 3, 4 or 6:
Normally, you find the error this way. If not, you can try rewriting the code in small bites: Start with a version that is compiled without errors. Then gradually add small pieces and check the code again by compiling it. Eventually, you will reach the incorrect location, or you will have automatically written the code correctly.
Sometimes you can fix errors with Visual Studio Quick Actions
In the following example, I have modified the program from the last post so that it has an error in line 5. The compiler does not know the name “Turtle”. If you place the cursor in the faulty line, a small light bulb is displayed at the beginning of the line, showing so-called Quick Actions:
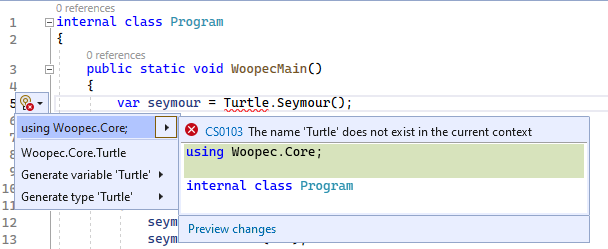
Four different Quick Actions are suggested here. The first one is exactly what is missing here: A using Woopec.Core; statement must be added at the top of the file. You can correct this directly with the Quick Action. When fixing compiler errors, you have to be a little careful with the Quick Actions. The other three suggestions in this example would not have helped at all. Often there is nothing that helps at all. But sometimes the right suggestion is there.
By the way: Visual Studio keyboard shortcuts
These were a few tips for fixing compiler errors. Before I give a few tips on debugging, I would also like to briefly mention the Visual Studio Keyboard Shortcuts. I have already mentioned the shortcut Ctrl+] above, with which you can jump back and forth between corresponding brackets. This is just the tip of the iceberg. Visual Studio’s text editor has over 100 shortcuts. You can find the complete list here.
Watch the program at work: The debugger
Your program no longer has compiler errors, but when you run it, it doesn’t do the right thing. Then the best thing to do is to use the Visual Studio debugger to find out what is wrong. There are many good tutorials about the Visual Studio debugger. However, most of the time it is assumed that you have already written some more C# code. But I find that the debugger is super helpful right from the start. That’s why I show a few basics here. For this I take the example from the beginning of the last post:
public static void WoopecMain()
{
    var seymour = Turtle.Seymour();

    seymour.Left(60);
    seymour.Forward(100);
    // ...
    seymour.Left(60);
    seymour.Forward(100);
}
All necessary commands can be found in the Debug menu of Visual Studio:
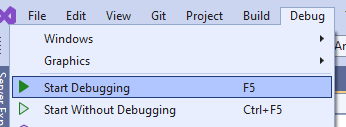
With the debugger you can run the program step by step and check what it does. Each command can also be executed via a function key. If possible, you should set up your computer so that you can work with the function keys. If this is not possible, you can use the menu items or click on the appropriate icons that Visual Studio displays below the menu.
Start Debugging
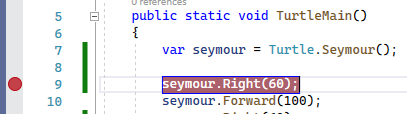
Before you start the program (and also while the program is running), you can place the cursor on a line in the program and select the F9 key (or the “Toggle Breakpoint” entry in the debug menu). The statement will then be highlighted in red and the line marked with a dot:
This means that a breakpoint is now set there.
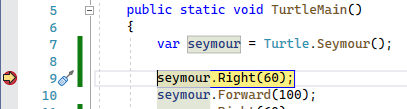
Then you start debugging (F5 key). The debugger stops at the first breakpoint and indicates this by marking the position in yellow:
Before you continue, you should place the Visual Studio window and the Turtle program window side by side. In Windows 11, this is easily done by moving the mouse to the Resize icon and then selecting the option to display Visual Studio on the right side of the screen:
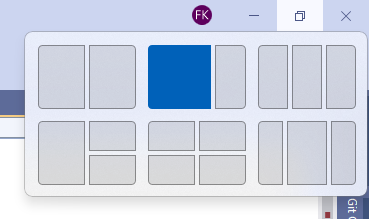
After you click on the blue rectangle, Visual Studio shrinks to the right half of the screen and a list of windows is displayed to the left of it, from which you can select the window for the left half. Here you choose the Turtle program window. After that your screen should look like this:
Now the editor window of Visual Studio is relatively small. We can improve this by changing the window layout. How this works is described in Microsoft Learn. The best way is to save the current layout via “Save Window Layout” under a meaningful name (for example “DebuggingDefault”). After that we clean up the windows a bit: First, we close the “Diagnostic Tools” window. This allows the editor window to use the whole width. We can also move all windows from the bottom right to the bottom left window, so that there are only two windows left. Then we can save this Window layout under a different name, for example “DebuggingSmall”. Now Visual Studio looks like this:
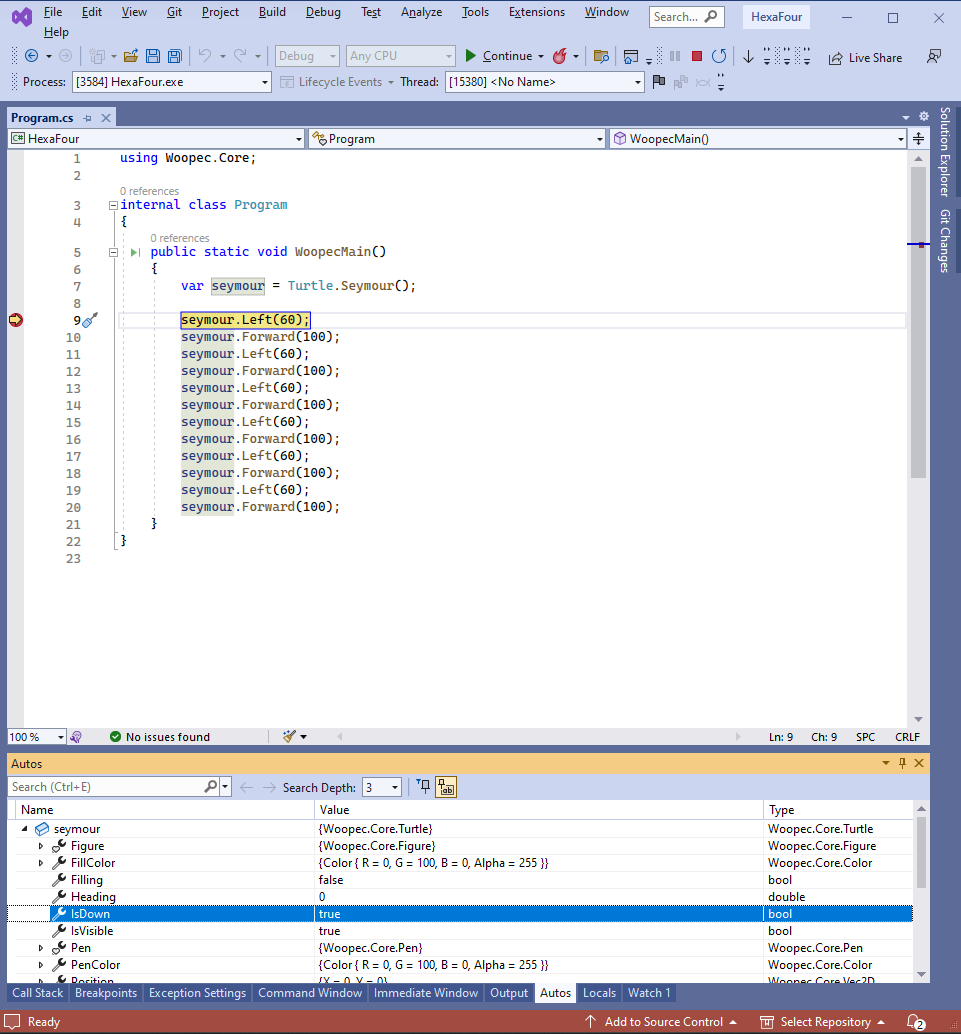
In this screenshot you can see the Autos Window in the lower part. This window shows the variables of your program. In this example the variable seymour is shown. You can expand and collapse it to see the values of the individual properties of seymour. For example, in the highlighted line you can see that the value of the property IsDown has the value true.
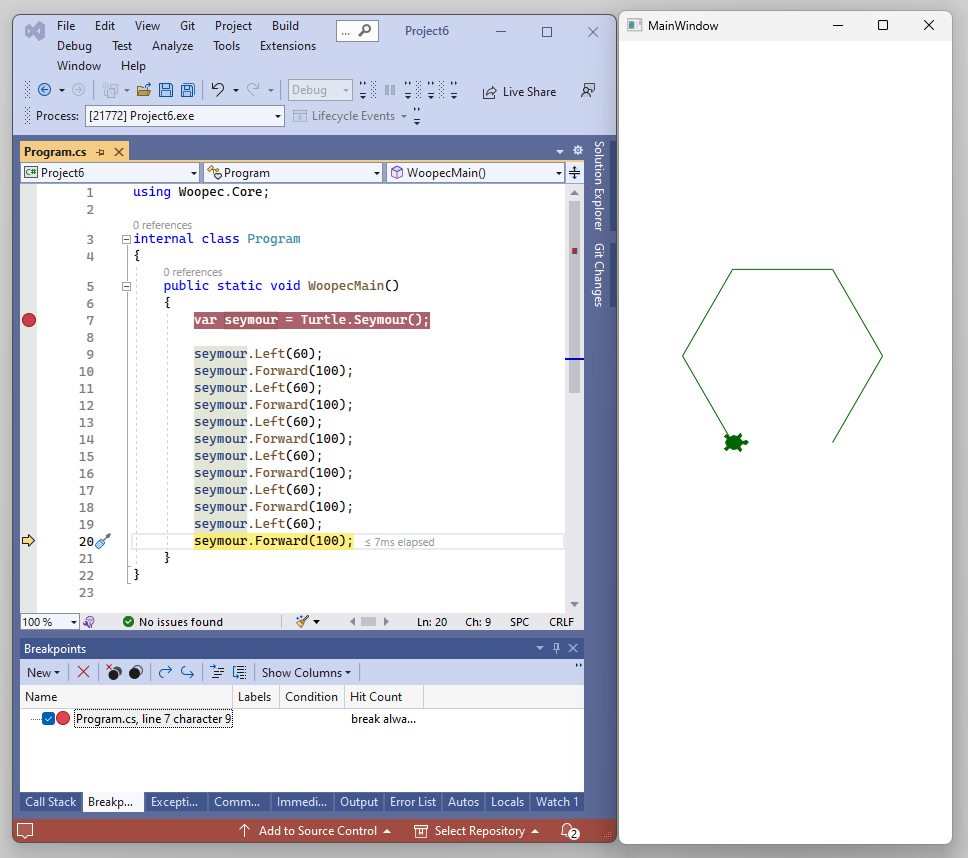
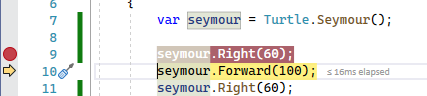
Now you click once in the code editor of Visual Studio, so that the focus is in Visual Studio. Then you can execute the program step by step: By pressing key F10 (function “Step Over” in the Debug Menu) the next statement of the program will be executed. So in the example above, the Turtle rotates 60 degrees to the right. In the Visual Studio window the yellow marker moves to the next statement:
The next click of F10 will execute the next statement. You can also set another breakpoint, for example in the line further down:
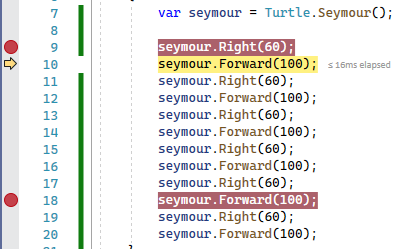
If you then select the F5 key (or “Continue” in Debug menu), the program continues to run normally and only stops again when it has reached this breakpoint.
With the Shift-F5 key (or “Stop Debugging” in Debug menu) you can stop debugging at any point.
Debugging is extremely helpful because this way you can watch your code at work. If something doesn’t work as desired, you can quickly find the error. When I changed something in my program, I always do it like this: I set a breakpoint on the first statement I changed, then start the debugger and check step by step if the program does exactly what I thought it would.
One last note: If you want to change the code of your program, you should stop debugging before.
The bottom line
That was a lot of technology. But the debugger is very useful if you are looking for errors and want to understand how the program works.
In the next post, we’ll continue with our HexaFour game. Until then you can play around with the Turtle commands, write your own programs and debug them. For example, you could try to draw a hexagonal star.
TL;DR
This post is part of a series. You can find the previous post here and an overview here.
Compiler errors:
- The compiler does not see spaces, indentations or line breaks. It needs semicolons and matching brackets to understand the code correctly. Finding errors is helped by the Error-List Window, Quick Actions, commenting out code, and the keyboard shortcut Ctrl+], you can also rewrite the code in small pieces.
- For more information on fixing errors, see for example Fix program errors and improve code on Microsoft Lean.
Debugging:
- Start debugging with F5, set breakpoint with F9, step over with F10, to next breakpoint with F5, end debugging with Shift F5.
- The Autos Window shows the values of variables.
- If you have little space on the screen: change the Visual Studio Windows Layout.
- For more information on debugging, see for example the videos C# 101 Debugging and .NET Core 101 Basic Debugging or the article First look at the debugger on Microsoft Learn.
If you want to change the code of your program, you should stop debugging before.
Comment on this post ❤️
I am very interested in what readers think of this post and what ideas or questions they have. The easiest way to do this is to respond to my anonymous survey.