Drawing spirograph curves (also called hypotrochoids) with C# turtle graphics
 (
(A while back I owned a Spirograph Set that could be used to draw figures like the example above. Mathematicians also call such curves Hypotrochoids. In last post we drew polygons and stars with turtle graphics, now we draw spirograph curves. We use some more advanced Woopec features (transparent filling, individual shapes and synchronized turtles).
What we want to achieve
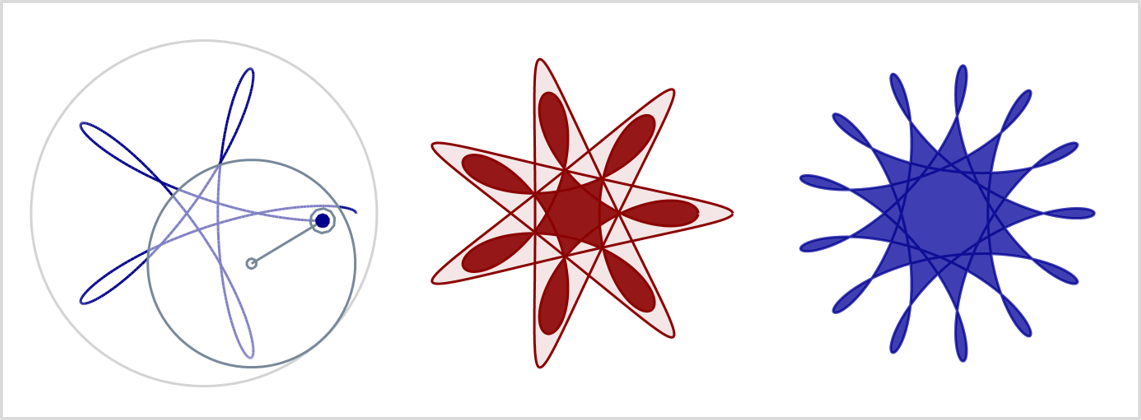
The following picture helps explain how spirograph curves are generated:
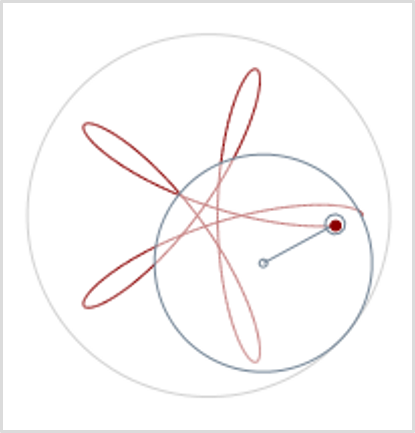
There is an outer circle that is fixed. Within this circle lies a smaller movable disc. The disc is unrolled on the larger circle (in the real Spirograph, the outer circle and the inner disc have small gears to make this work). There are small holes in the disc through which you can put a pen. By moving the disc, the pen draws a curve on the paper.
The following post describes what the program looks like for this.
How many different spirograph curves with eight corners are there?
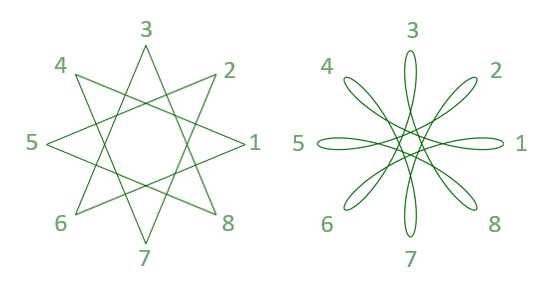
The curves drawn with Spirograph are similar to the stars we drew in the last post. In the image below you can see a star with 8 corners and a Spriograph curve with the same number of corners for comparison. Also the delta, which determines which corners are connected, is the same in both cases (namely 3).
Just like in the last post, the user should be able to specify any number of corners and any delta. Then the program should first check whether a curve with the desired number of corners can be drawn. The check method is almost the same as in the last post:
public static void CheckInputs(int givenCorners, int givenDelta)
{
    if (givenDelta == 1)
    {
        // OK. This is the regular spirograph curved polygon
    }
    else
    {
        // Check star properties
        var gcd = Fractions.GCD(givenCorners, givenDelta);

        if (gcd > 1)
        {
            // If the given values for corners and delta have a common divisor, the resulting spirograph curve has less corners.
            // We can calculate the real corners and the real delta of the resulting curve:
            var corners = givenCorners / gcd;
            var delta = givenDelta / gcd;
            throw new ArgumentException($"The given values would create a curve with {corners} corners and a delta of {delta}");
        }
    }
}
In the check method for the stars from the last post, cases were also rejected in which
givenDelta > givenCorners / 2.0.
This is because in such a case the same star is generated as with a delta = givenCorners - givenDelta. With Spirograph, the corners are also run through in the same order in both variants, but different curves result. We therefore allow both cases here.
We need some math again
Again, we need some math to calculate the curve.
There are two circuits in the Spirograph. We call the radius of the larger outer circle rLarge, the radius of the smaller circle we call rSmall. If the ratio between rLarge and rSmall is the same ratio as between corners and delta, the desired Spirograph figure will result.
The user can specify the values for corners, delta and rLarge. Then we can calculate rSmall from this:
rSmall = (rLarge * delta) / corners
For the calculation of the curve, the user must also specify the distance between the drawing hole and the center point of the circular disk. For this he specifies the value relativeDistance. With a value of 0.0, the drawing hole is in the center of the disc, with a value of 1.0 it is on the edge of the disc, and with smaller values it is further in the middle. You can also specify values greater than 1.0. The true distance of the drawing hole from the center is:
distance = rSmall * relativeDistance
With this we have all the values that are necessary for the calculation of the curve. The formulas for this can be found on Wikipedia. But if you also want to understand the derivation of these formulas, you can read this Spirograph article on the website “Mathematische Basteleien”. The method for calculating a curve point is as follows:
private static Vec2D CalcPenPos(double t, double rLarge, double rSmall, double distance)
{
    var sizeTerm = rLarge - rSmall;
    var ratio = rSmall / rLarge;
    var angle1 = ratio * t;
    var angle2 = (1 - ratio) * t;
    var x = sizeTerm * Math.Cos(angle1) + distance * Math.Cos(angle2);
    var y = sizeTerm * Math.Sin(angle1) - distance * Math.Sin(angle2);
    return new Vec2D(x, y);
}
We have described all input parameters of this method. Except for one: The parameter t. This parameter specifies the angle (measured in radians) by which the disc has already rotated on itself. Because the disk has to rotate once for each corner, all points for the interval of
0 <= t <= 2 * PI * corners
have to be calculated.
The first version of the program
The final program for drawing a spirograph curve is relatively short:
using Woopec.Core;

public static void SpirographCurve(int corners, int delta, double relativeDistance, double rLarge)
{
    CheckInputs(corners, delta);

    var pen = new Turtle() { IsVisible = false, IsDown = false, Speed = Speeds.Fastest };

    var rSmall = (rLarge * delta) / corners;
    var distance = rSmall * relativeDistance;
    var maxT = 2 * Math.PI * corners;
    var deltaT = 0.05;

    var firstPos = true;
    for (var t = 0.0; t < maxT; t += deltaT)
    {
        pen.Position = CalcPenPos(t, rLarge, rSmall, distance);
        if (firstPos)
            pen.PenDown();
    }
}
Animated program version
Next, let’s extend the program to simulate Spirograph behavior:
For this simulation we first need the large circle. Instead of a perfect circle, let’s just draw a polygon with many corners (we’ll use the procedure from the previous post for this)
var largeCirclePen = new Turtle() { IsVisible = false, IsDown = false, Speed = Speeds.Fastest, Color = Colors.LightGray };
DrawStar(largeCirclePen, 100, 1, rLarge); // See last post
For the outer circle we use the color Colors.LightGray. This is a color defined in Woopec, if the compiler finds the name of the color ambiguous, you should add the following using commands at the top of the program:
using Woopec.Core;
using Colors = Woopec.Core.Colors;
using Shape = Woopec.Core.Shape;
The inner disc has four components: the disc, a point in the middle, a hole further out, and a connection between the center and this hole. We create a polygon list for each part and combine these lists into a Woopec.Core.Shape:
var smallCirclePoly = StarPoly(100, 1, rSmall);
var centerCirclePoly = StarPoly(10, 1, 2);
var dotCirclePoly = StarPoly(10, 1, 5).Select(p => p + (0, rSmall * relativeDistance)).ToList();
var lineToDotPoly = new List<Vec2D>() { (0, 0), (0, Math.Max(0, (rSmall * relativeDistance) - 5)), (0, 0) };

var innerWheelShape = new Shape(smallCirclePoly);
innerWheelShape.AddComponent(centerCirclePoly);
innerWheelShape.AddComponent(dotCirclePoly);
innerWheelShape.AddComponent(lineToDotPoly);
We can now create a “turtle” that looks like this disk:
var innerWheel = new Turtle()
{
    Shape = innerWheelShape,
    Speed = Speeds.Fast,
    IsVisible = true,
    IsDown = false,
    PenColor = Colors.LightSlateGray,
    FillColor = Colors.White.Transparent(0.5)
};
innerWheel.Position = (rLarge - rSmall, 0);
There are two points to note here: Because this innerWheel is going to be animated in the next step, Speed must not be set to the highest speed, we must throttle the speed from Fastest to Fast. And we need to make the FillColor transparent so that we can see the curve behind the disk..
Every time a curve point is drawn, the center point of the disc has to be shifted a bit. The position is calculated by this method:
private static Vec2D CalcInnerWheelCenterPos(double t, double rLarge, double rSmall)
{
    var distanceToLargeWheelCenter = rLarge - rSmall;
    return new Vec2D(
        Math.Cos(t * rSmall / rLarge) * distanceToLargeWheelCenter,
        Math.Sin(t * rSmall / rLarge) * distanceToLargeWheelCenter
    );
}
In addition, the disc must rotate a little about itself using the Right command. The rotation angle for this Right command is calculated like this:
var loopCount = maxT / deltaT;
var innerWheelRotAngle = (corners - delta) * 360.0 / loopCount;
With the above things added in the SpirographCurve method, we can modify the main loop of the method as follows:
innerWheel.Position = (rLarge - rSmall, 0); // Move to start
innerWheel.Left(innerWheelRotAngle); // Prepare for t = 0.0

var firstPos = true;
for (var t = 0.0; t < maxT; t += deltaT)
{
    pen.WaitForCompletedMovementOf(innerWheel); // sync with innerWheel !

    pen.Position = CalcPenPos(t, rLarge, rSmall, distance);
    innerWheel.Position = CalcInnerWheelCenterPos(t, rLarge, rSmall);
    innerWheel.Right(innerWheelRotAngle);
    if (firstPos)
    {
        pen.PenDown();
    }
}
One point needs to be explained: Normally, all animations in Woopec are executed in parallel and independently of each other. In the above example, this would result in the pen drawing the curve faster than the innerWheel is turning. The command
pen.WaitForCompletedMovementOf(innerWheel)
ensures that the pen synchronizes with the innerWheel.
That’s it. We’re done.
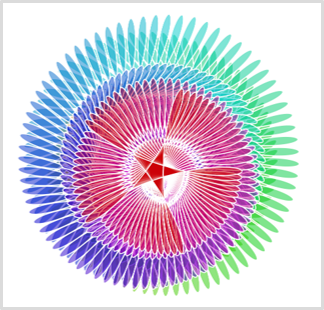
Finally, an example that uses Spirograph curves to paint a nicer picture. The code for this example first generates a polygon list with the points of a spirograph curve. Then a shape is created from this. With this shape, turtles are created in rainbow colors with a transparent filling, rotated a little bit and then they are drawn. This is the result:
Further information
- On Jürgen Köller’s website Mathematische Basteleien you will find over a hundred articles with information on polygons, stars, spirograph curves, other curves and many other interesting mathematical objects. If you want to draw other mathematical objects with C# graphics, you will definitely find something there.
- While writing this post, I came across the Spiro Project. It’s written in a completely different programming language, but what impressed me was what you can do with Spirograph curves.
Comment on this post ❤️
I am very interested in what readers think of this post and what ideas or questions they have. The easiest way to do this is to respond to my anonymous survey.